Exposing Metrics via JMX
In the last post we have discussed a bit how to use Dropwizard’s metrics, a great library that helps adding metrics to a Java application. In this post, we’ll see a very simple example project with a couple of metrics in it, and then we’ll expose those via JMX and monitor them via VisualVM.
The code
The code for this post is available on GitHub at https://github.com/andreabergia/metrics-jmx. Let’s see the simple Main class:
public class Main {
    public static void main(String[] args) throws InterruptedException {
        MetricRegistry metrics = new MetricRegistry();
        registerMemoryMetrics(metrics);
        initReporters(metrics);
        waitUntilKilled();
    }

    private static void registerMemoryMetrics(MetricRegistry metrics) {
        Gauge<Long> getFreeMemory = () -> toMb(Runtime.getRuntime().freeMemory());
        Gauge<Long> getTotalMemory = () -> toMb(Runtime.getRuntime().totalMemory());
        metrics.register(MetricRegistry.name(Main.class, "memory.free.mb"), getFreeMemory);
        metrics.register(MetricRegistry.name(Main.class, "memory.total.mb"), getTotalMemory);
    }

    private static long toMb(long bytes) {
        return bytes / 1024 / 1024;
    }

    private static void initReporters(MetricRegistry metrics) {
        initConsoleReporter(metrics);
        initJmxReporter(metrics);
    }

    private static void initConsoleReporter(MetricRegistry metrics) {
        final ConsoleReporter reporter = ConsoleReporter.forRegistry(metrics)
                .build();
        reporter.start(1, TimeUnit.SECONDS);
    }

    private static void initJmxReporter(MetricRegistry metrics) {
        final JmxReporter reporter = JmxReporter.forRegistry(metrics).build();
        reporter.start();
    }

    private static void waitUntilKilled() throws InterruptedException {
        List<String> memoryWaste = new ArrayList<>();
        char[] data = new char[1_000_000];
        while (true) {
            memoryWaste.add(String.copyValueOf(data));
            Thread.currentThread().sleep(100);
        }
    }
}
We start by creating a MetricsRegistry, which is the container of our metrics. Afterwards, we register a couple of metrics: the currently used memory and the free memory, obtained via the standard Runtime class.
Next, we register a couple of reporters: one to the console, which will log the metrics’ values to the standard output every second, and one to JMX.
Finally, we start an endless loop to waste some memory, just to see our metric’s value change.
When launching the program, the output will be something like:
9/27/15 3:37:49 PM ==============================================

-- Gauges -------------------------------------------------------
com.andreabergia.metricsjmx.Main.memory.free.mb
             value = 191
com.andreabergia.metricsjmx.Main.memory.total.mb
             value = 240
Monitoring via JMX
Since we are exposing our metrics’ values to JMX, we can use a standard tool such as VisualVM to monitor their value. If we launch it and install the VisualVM-MBeans plugin, we can see all the JMX-exposed beans via VisualVM, as the screenshot shows.
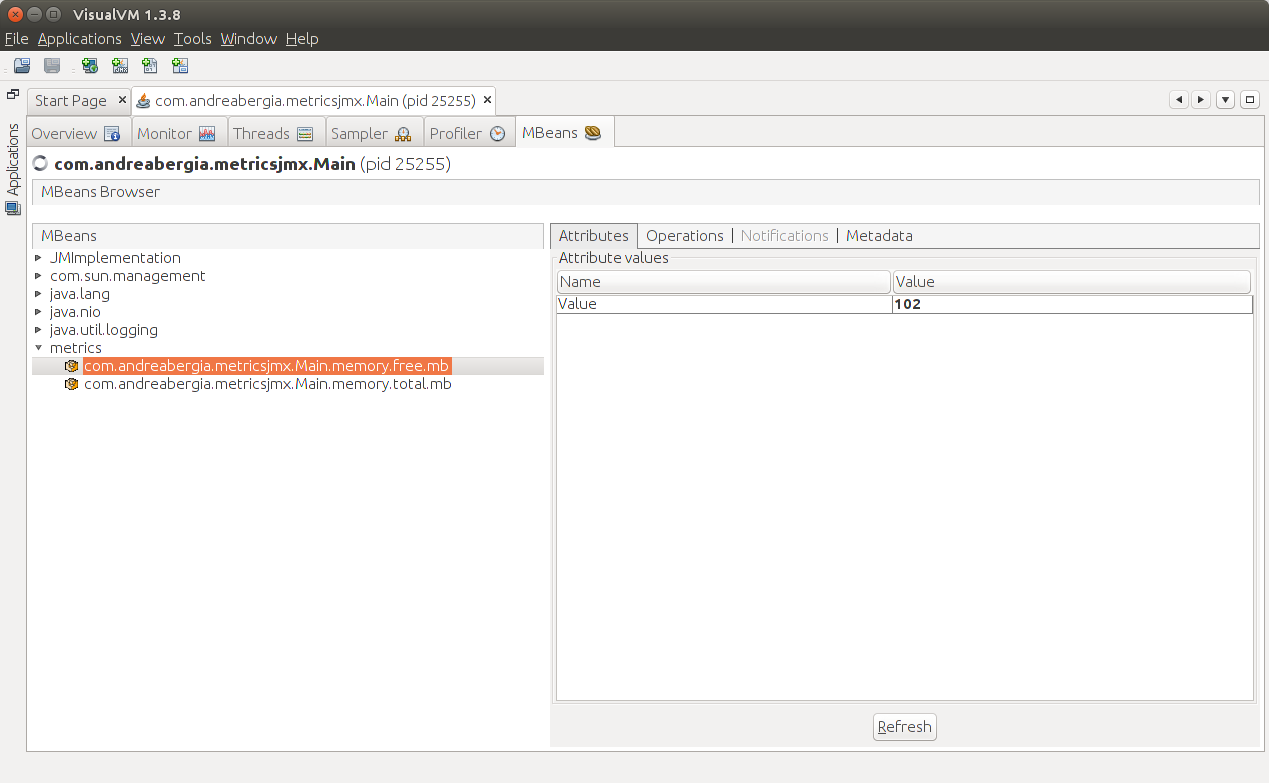
In the “MBeans” tab we can see a “metrics” node; underneath it we’ll find an element for each metric we have registered. By double-clicking on the value, VisualVM will start to trace a graph of it:
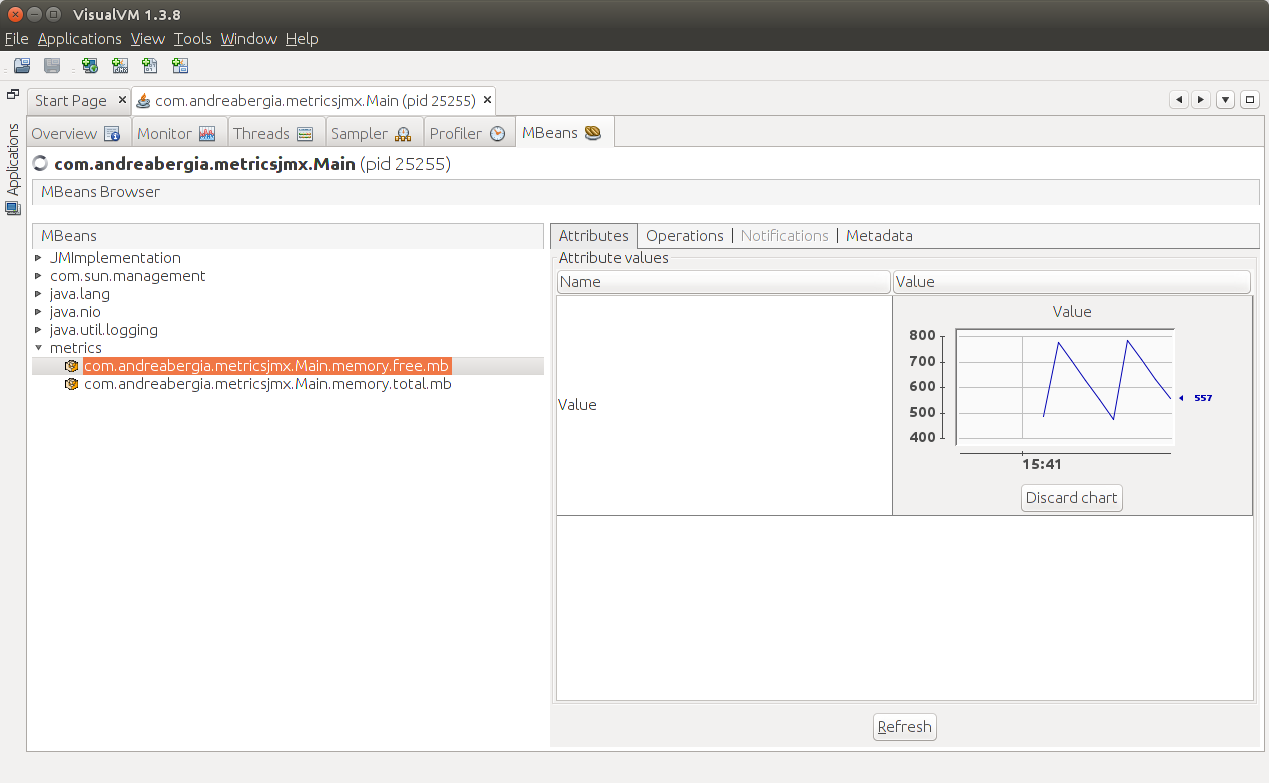
While this kind of monitoring is perhaps simple, it can be of invaluable help when examining a running application’s performances. The fact that we can simply use standard tools like VisualVM is a great thing: we don’t need to install any particular software (except, of course, for the JDK) to monitor our applications.
This is, in my opinion, one of the greatest things about Java - the tooling. The JVM is a very mature platform and has some really great monitoring capabilities built in into it, that helps a lot when creating or managing real applications.