Debugging tricks for IntelliJ
I have been using IntelliJ Idea at work for a decade or so by now, and it’s been a reliable companion. JetBrains IDEs have a bit of a reputation for being slow, but their feature set is incredible: powerful refactoring tools, a great VCS UI (though I like magit even more!), a huge number of supported frameworks, integration with just about any testing library for any language, code coverage tools, powerful debuggers, etc.
Today, I wanna show you some more advanced features of the debugger. I have known many programmers who rely mostly on “printf debugging” - which, frankly, is fine and more than enough in many circumstances. But sometimes, using a debugger can be a lifesaver for handling more complex problems.
IntelliJ’s debugger is not the most powerful one around - there are more specialized debuggers that can do amazing things such as time travel - but it is a pretty powerful tool nevertheless. Most of the following tips apply to all JetBrains IDEs, including GoLand, RustRover, WebStorm, PyCharm, etc.
I’m going to assume you’ve used a debugger before and are familiar with the basics (breakpoints, step into/over/out, and watches), so I won’t cover those.
Conditional breakpoints Link to heading
This is a simple feature that most debuggers have: you can attach a condition to a breakpoint. The debugger will only pause at the breakpoint if the condition evaluates to true.
This works in most JetBrains IDEs, and the official documentation, with video, is here.
Setting a value Link to heading
The “Threads & Variables” window shows all local variables and function arguments, which is useful. But something many people don’t know is that you can actually modify a variable’s value from that window. You can even evaluate an expression like MyClass.aStaticField = true and change values that aren’t displayed in the variables list.
You can find the documentation at this link.
Run to cursor Link to heading
In some situations, like debugging a multithreaded program, a “core” function might be hit constantly by background threads. Placing a breakpoint there can be impractical because it triggers too often. A strategy for this is to put a breakpoint in a high-level method, like an HTTP API entrypoint, and then go step-by-step until you reach the code you want to debug. To make this simpler, you can use the “run to cursor” feature:
- break at your high-level entrypoint
- navigate into the function you actually want to debug
- press “run to cursor”.
The thread you are investigating will resume and then automatically pause when it reaches the cursor, while all other threads remain unaffected.
Documentation with videos is here.
Exception breakpoints Link to heading
A very useful feature, and a lifesaver in the rare circumstances you’ll need it, is the “exception breakpoint”. This is a special kind of breakpoint that will be triggered whenever an exception of a specified type is thrown. You can also add details, like filtering for caught/uncaught exceptions or by caller.
Here is the documentation.
Field watchpoints Link to heading
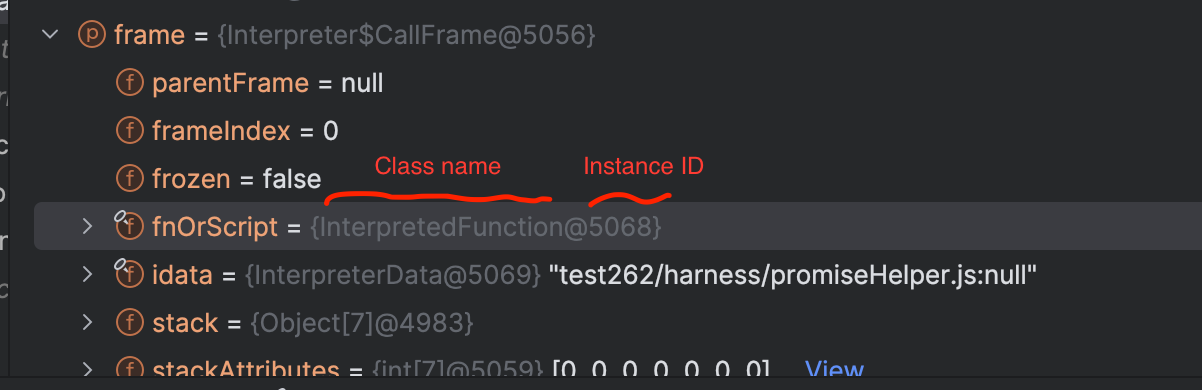
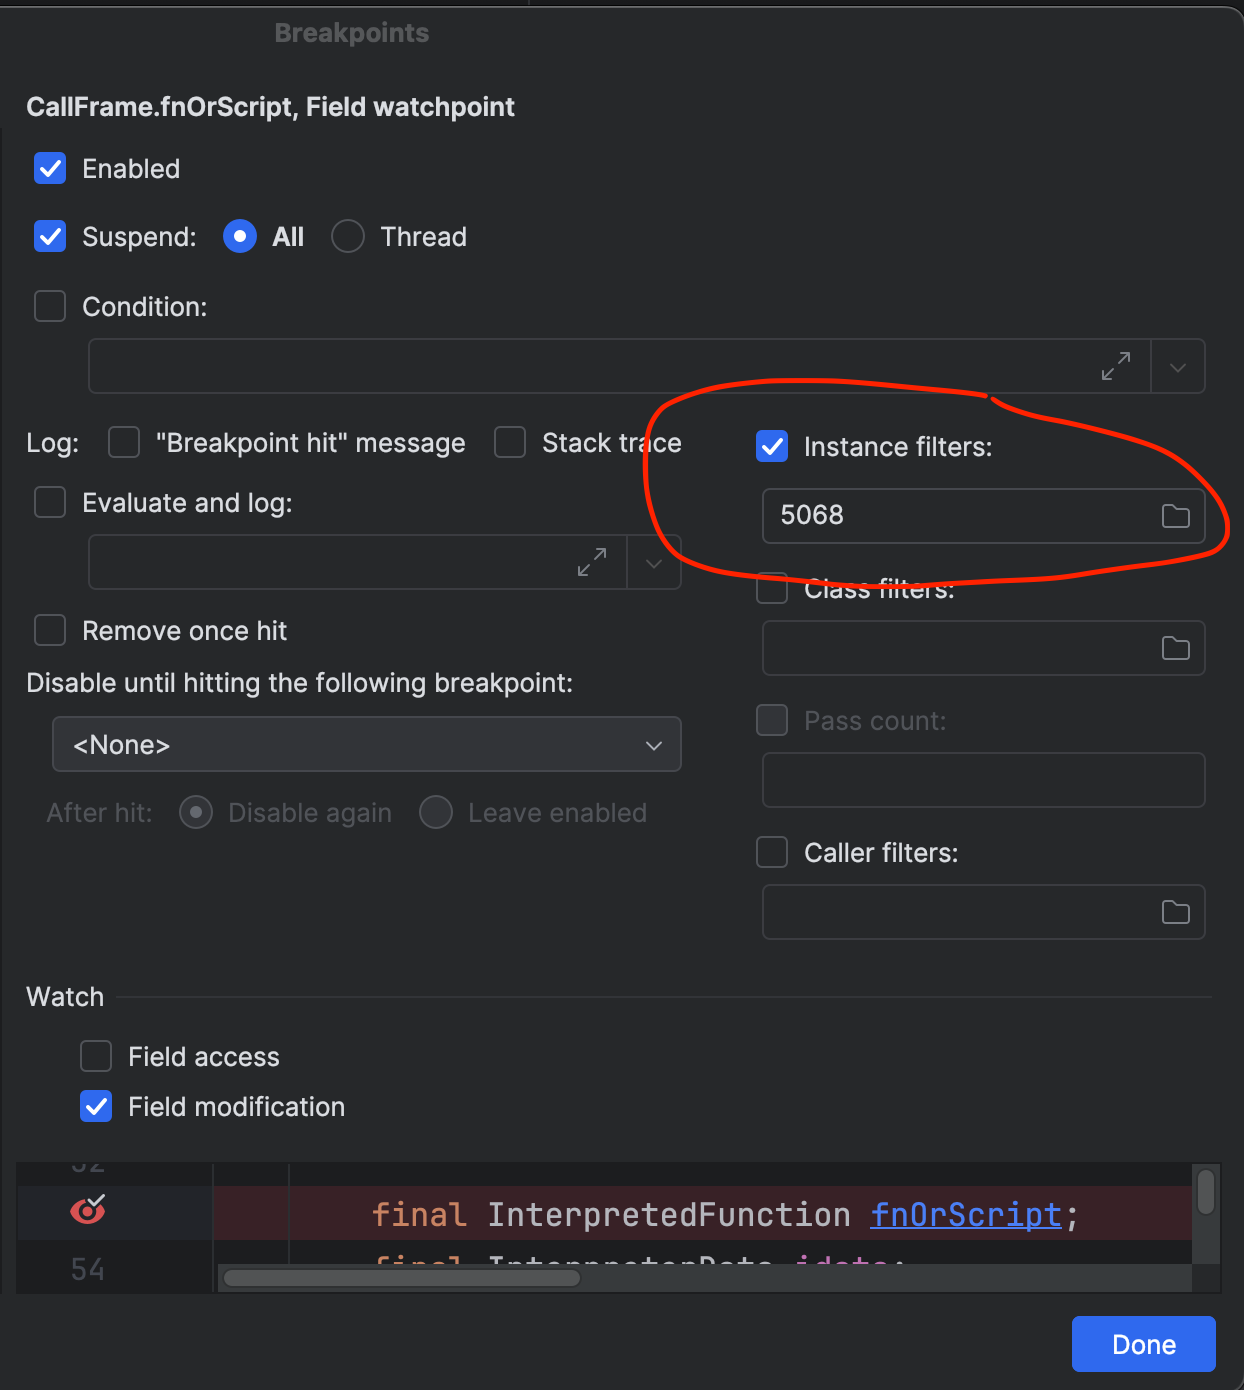
The last super-useful kind of breakpoint is the field watchpoint. This will automatically pause execution whenever a field is modified, regardless of where the modification happens (in a setter, or by any code if the field is public). By default, it’s enabled for any instance of the class, but you can restrict it to a single object using the “instance filter” field and setting it to the ID of the object you are interested in. To find an instance ID, note that objects are always displayed as class name@instance ID in the debugger window.
Note that this feature can also be configured to pause on field access (reading the value), not just modification.
The documentation is here.
Marking objects Link to heading
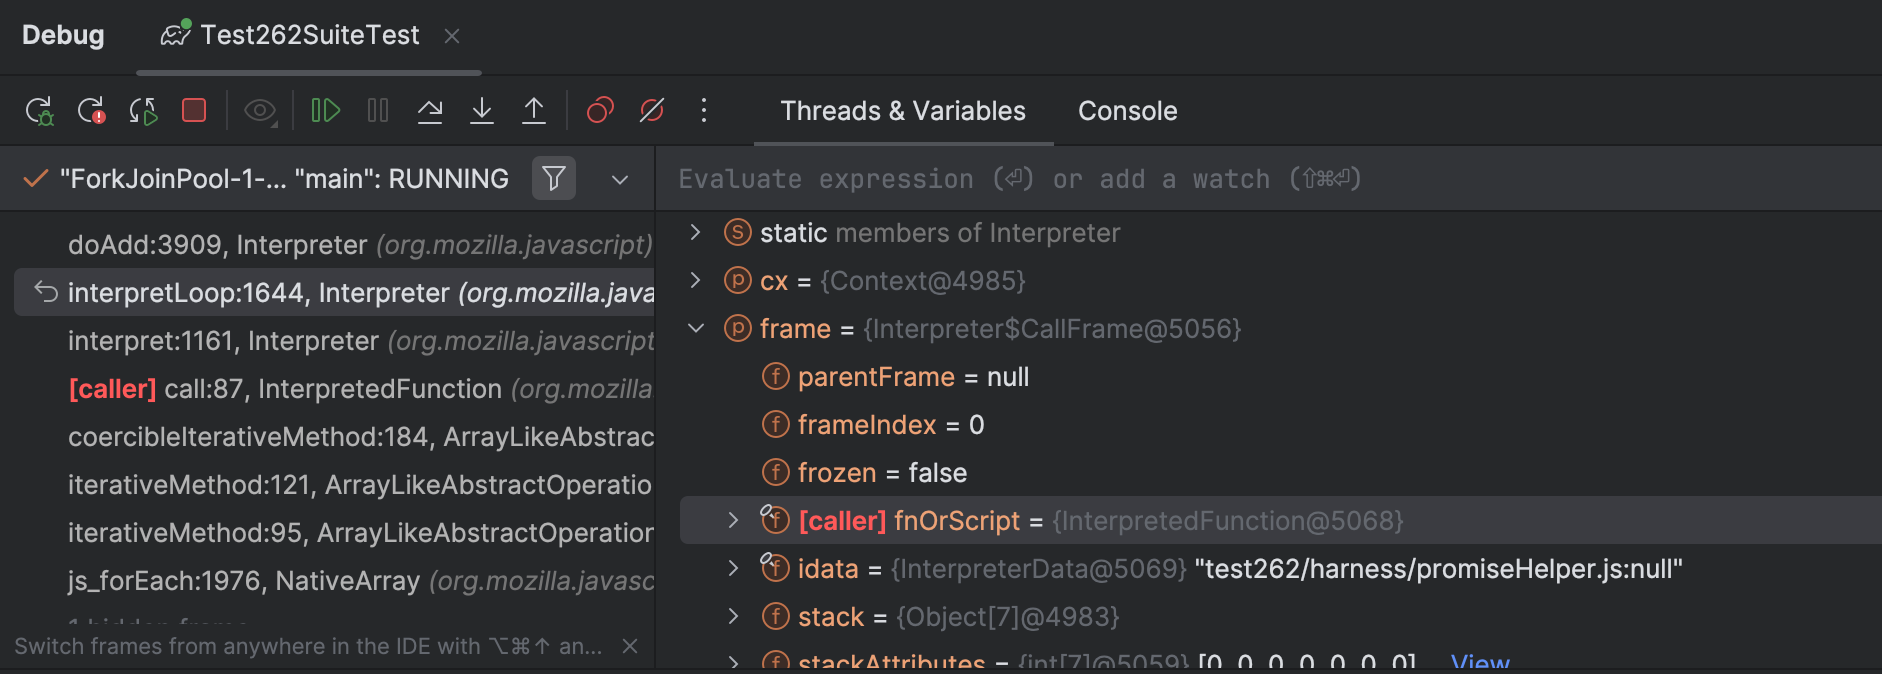
One very nice feature I discovered recently is the ability to mark an object. This lets you assign a text label to a particular instance, which will always be shown next to it in the debugger. If you need to track multiple objects of the same class, this can be super helpful for quickly distinguishing them at a glance.
As an example, note the caller label in the following screenshot.
The documentation is here.
Reset frame and throw exceptions Link to heading
My final tip is the ability to drop a frame, which basically restarts the execution of the current function. This can be super helpful to re-check the code at the beginning of a function you just stepped past, without having to restart the whole debugging session. It’s not exactly a time-travel debugger, but it’s a decent approximation in many cases. Obviously, side effects (like variable assignments or any I/O) won’t be reset, but it can still be very helpful.
Additionally, you can also force the JVM to do a few similar things, such as return early from a method, or throw an exception.
All the revelevant documentation can be found on this page.
Conclusions Link to heading
IntelliJ’s debugger is very powerful, and these advanced features might just make your life better in those infrequent circumstances when you need them. I hope these tips serve you well in the future! ☺️